US Fertility Rate Hits Another Record Low, Continuing Long Decline Since 2007

The U.S. fertility rate has reached another record low, surpassing the prior year’s already declining rate and bringing significant implications for families, healthcare costs and the broader economy. In 2024, there were just 53.8 births per 1,000 women ages 15 to 44, down 1.3% from 54.5 births in the year prior. The overall downward trend has continued since 2007, when the fertility rate peaked at 69.3.
Over those nearly two decades, the fertility rate has fallen by a whopping 22.4%, though for now, births still (slightly) outpace deaths nationally. Below, we’ll look at fertility rates and the birth-to-death ratio by state, as well as offer tips for navigating a changing market and aging population.
On this page
- Key findings
- U.S. fertility rate hits another record low
- Fertility rates vary dramatically by state
- Fertility rose in 12 states even as the national rate fell
- More Americans are being born than dying, but some states see more deaths
- Tips for navigating health insurance during major family planning milestones
- Methodology
Key findings
- U.S. fertility hits another record low. The fertility rate declined to 53.8 births per 1,000 women ages 15 to 44 in 2024, down from 54.5 in 2023 — a 1.3% decrease. Since hitting a peak of 69.3 in 2007, the fertility rate has fallen by 22.4%.
- South Dakota has the highest fertility rate in the U.S. The Mount Rushmore State’s fertility rate is 66.7 births per 1,000 women, which is 24.0% above the national average. Nebraska (62.9) and Alaska (60.8) follow. Meanwhile, the District of Columbia (39.8), Vermont (41.7) and Rhode Island (45.0) have the lowest fertility rates.
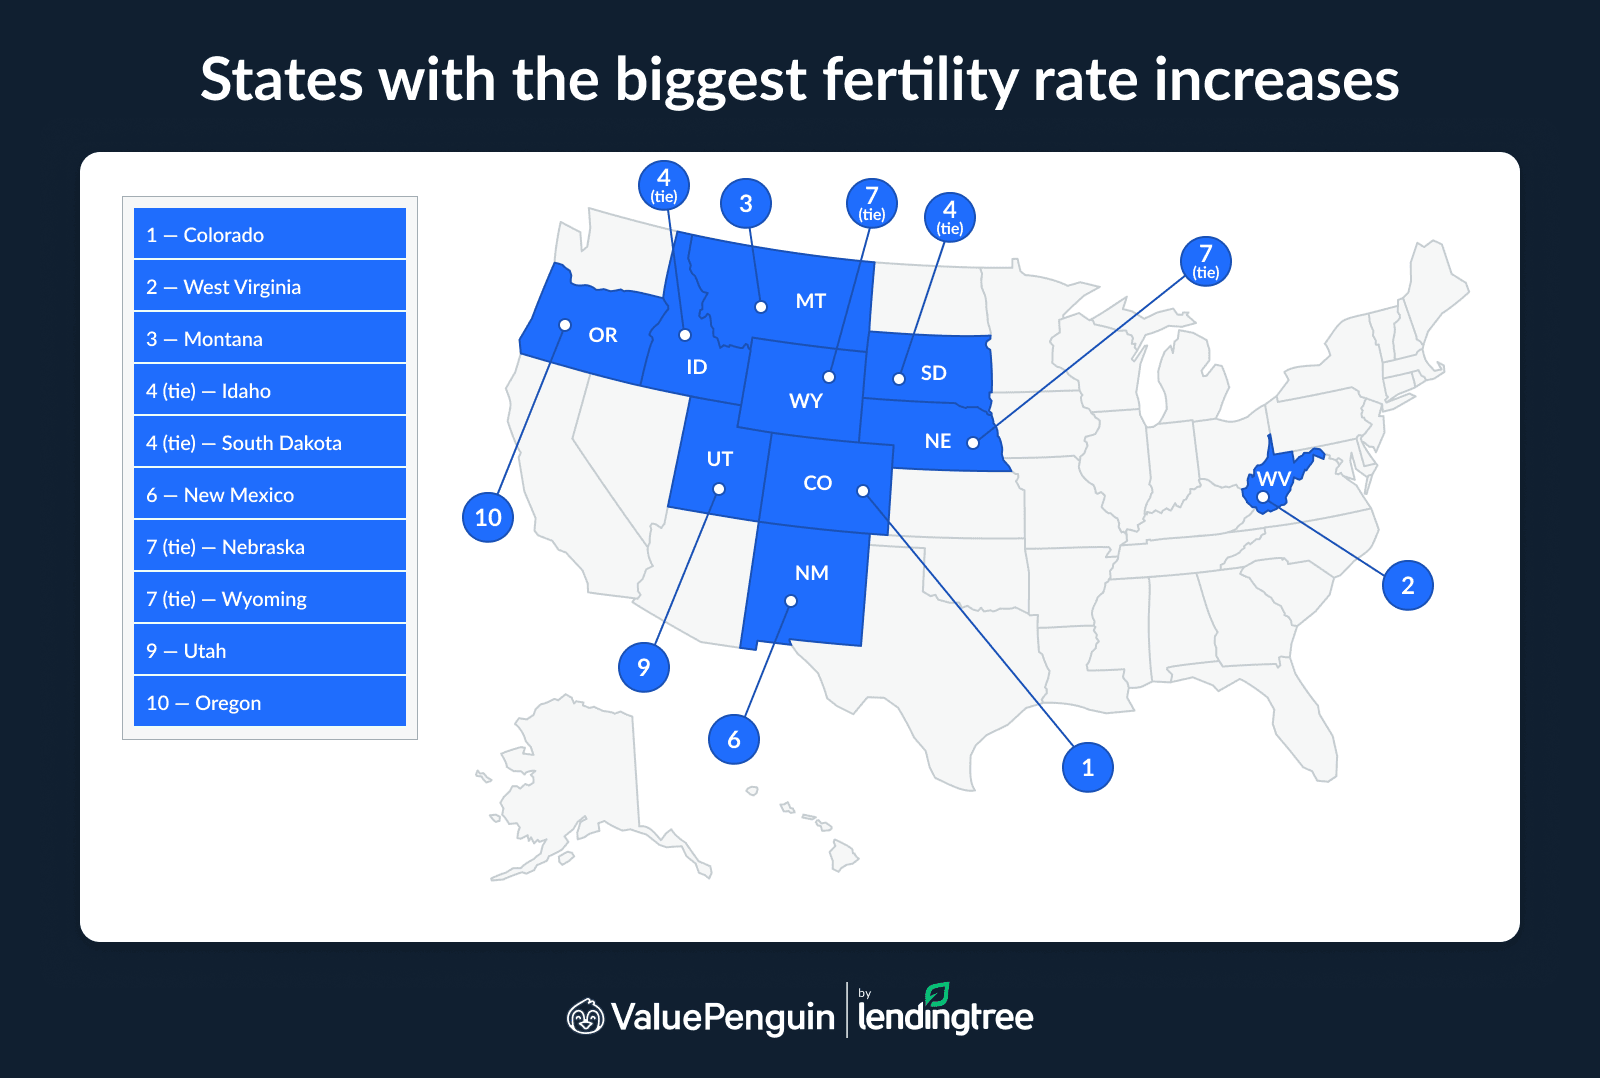
- Despite the nationwide decline, fertility rates rose in 12 states. Colorado had the highest increase from 2023 to 2024 at 2.8%, followed by West Virginia at 2.3% and Montana at 2.1%. Fertility rates declined the most in the District of Columbia (7.4%), Louisiana (3.6%) and Florida and Mississippi (both at 3.2%).
- The birth-to-death ratio is 1.18. The total number of births in the U.S. reached 3.63 million in 2024, compared with 3.07 million deaths. By state, Utah leads with 2.17 births per death, followed by Texas (1.70) and Alaska (1.62). In contrast, 16 states saw more deaths than births, with Maine and West Virginia hit hardest at a ratio of 0.70 — meaning there were only seven births for every 10 deaths.
U.S. fertility rate hits another record low
Across the U.S. in 2024, only 53.8 births occurred per 1,000 women ages 15 to 44. Along with representing a 1.3% year-over-year decrease from 54.5 in 2023, the figure has also plummeted 22.4% since its 2007 peak of 69.3.
(Note: The provisional 2025 birth rate of 53.1 births per 1,000 women indicates yet another 1% year-over-year decline, but since these figures are still provisional, our analysis focuses on 2024.)

There has been no shortage of headlines and think pieces about the declining birth rates in the U.S. and many other countries. While this global trend is likely impacted by many different social and economic factors, the ever-increasing cost of childcare — and healthcare — likely plays a part in many people choosing not to reproduce. (This may also be why the only age demographic that saw an increase in fertility rate from 2023 to 2024 was women ages 40 to 44, who have had more time to get financially established. Meanwhile, the largest drop was among mothers ages 15 to 19.)
Fertility rate changes by age (2023 to 2024)
Age of mother | Fertility rate, 2023 | Fertility rate, 2024 | Change (%) |
|---|---|---|---|
| 15 to 19 | 13.1 | 12.6 | -3.8% |
| 20 to 24 | 57.7 | 55.8 | -3.4% |
| 25 to 29 | 91.0 | 89.5 | -1.6% |
| 30 to 34 | 94.3 | 93.7 | -0.6% |
| 35 to 39 | 54.3 | 54.3 | 0.0% |
| 40 to 44 | 12.5 | 12.7 | 1.7% |
Source: ValuePenguin analysis of Centers for Disease Control and Prevention (CDC) data. Note: The fertility rate is births per 1,000 women for each age range.
The resultant drop in births can contribute to a vicious cycle, pushing healthcare costs even higher, ValuePenguin health insurance expert Cate Deventer says.
"A declining fertility rate can slowly change the makeup of health insurance risk pools," she explains. "Over time, fewer births mean fewer children entering employer-sponsored and individual health plans, which means the insured population becomes older on average. This can push costs higher for everyone because older populations tend to need more healthcare than younger populations."
Of course, such cost increases make it even more difficult for people to afford to raise children, continuing the trend.
Fertility rates vary dramatically by state
While the fertility rate is dropping nationally, trends vary significantly by state. In South Dakota, which boasts the highest fertility rate in the U.S., there were 66.7 births per 1,000 women ages 15 to 44 in 2024 — 24.0% higher than the national average. Nebraska (62.9) and Alaska (60.8) follow.
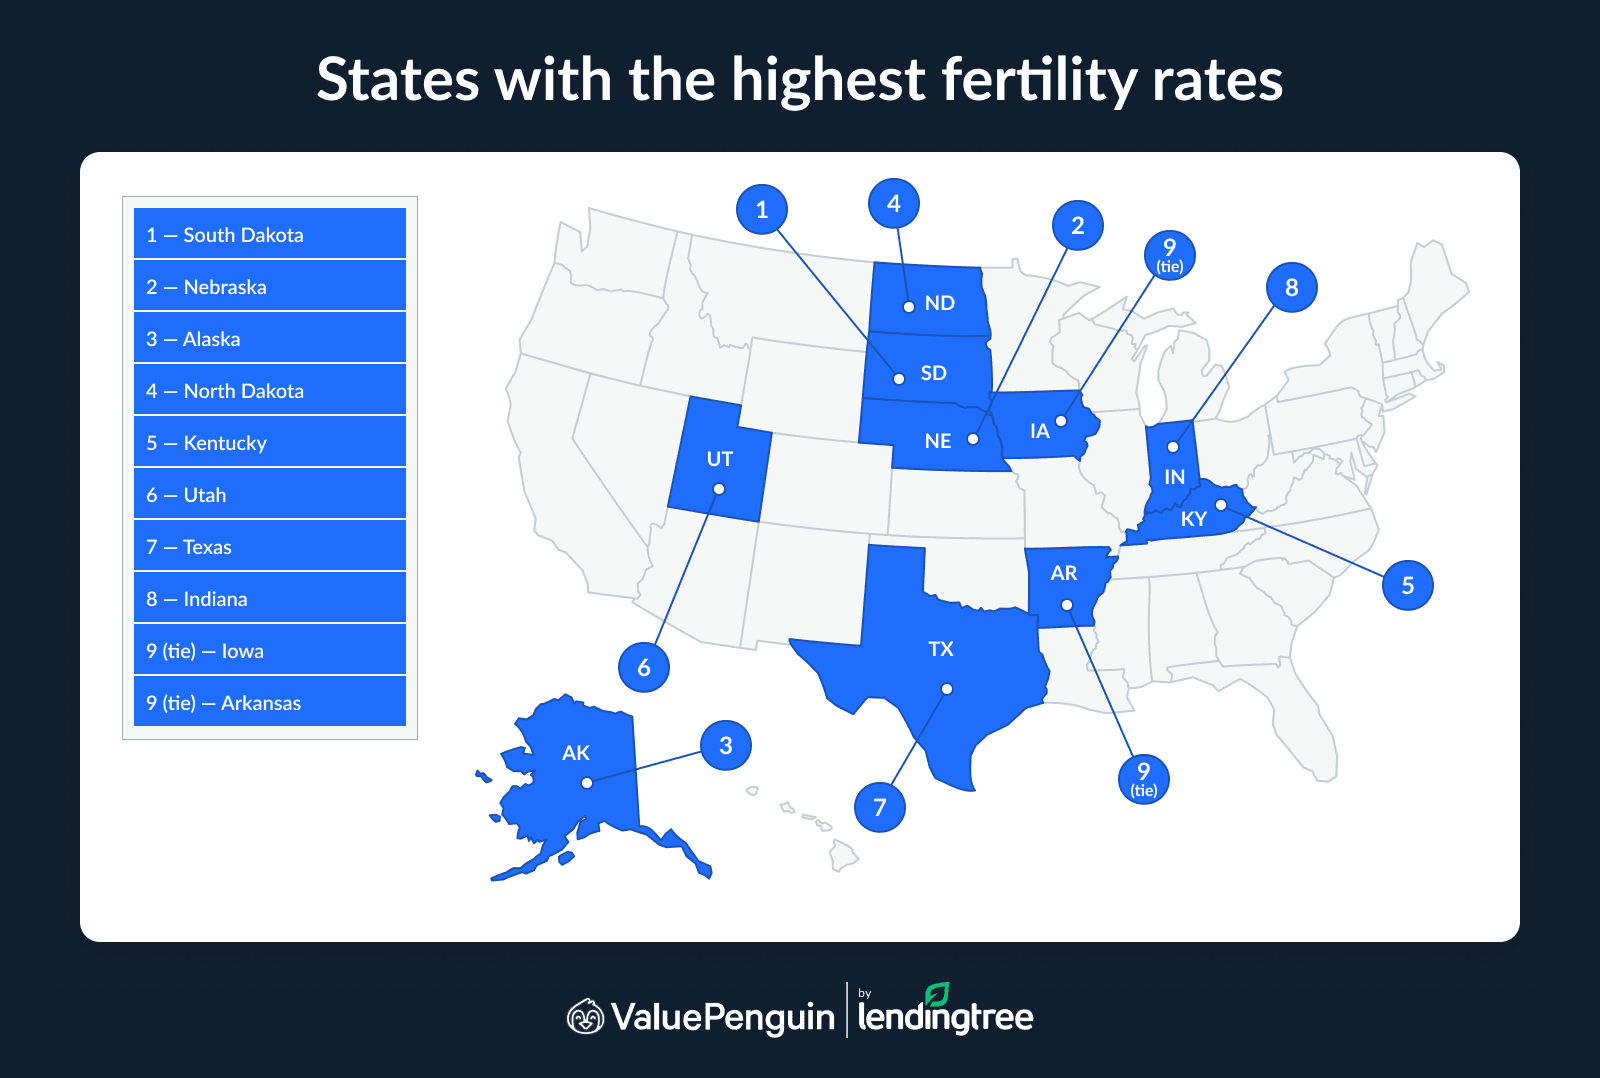
On the other end of the spectrum, the District of Columbia had the lowest 2024 birth rate at just 39.8 births per 1,000 women, followed by Vermont (41.7) and Rhode Island (45.0).
Factors affecting these differences could be partially cultural. Many of the states with higher birth rates are more rural and conservative, and maintaining traditional family structures (and larger families) may be a higher priority for residents.
A lower overall cost of living may also make raising children more accessible in some of these states, though the median household income is lower than the national median in both South Dakota and Nebraska. (Alaska’s median household income is higher, but so is its cost of living.)
Additionally, rural hospitals have been hit hard by changing Medicare and Medicaid payment structures over the last two decades, with almost 200 closing or partially closing since 2005 and hundreds more discontinuing certain types of services like chemotherapy.
Of course, states where more children are being born need more access to healthcare, not less. "Companies in those states are likely to see more claims related to maternity care, labor and delivery, newborn coverage, pediatric care and postpartum services," Deventer says.
But, meanwhile, nearly 140 rural hospitals have closed (or announced the closure of) their labor and delivery units since 2020 alone.
Full rankings: States with the highest/lowest fertility rates (2024)
Rank | State | Fertility rate |
|---|---|---|
| 1 | South Dakota | 66.7 |
| 2 | Nebraska | 62.9 |
| 3 | Alaska | 60.8 |
| 4 | North Dakota | 60.4 |
| 5 | Kentucky | 60.3 |
| 6 | Utah | 59.9 |
| 7 | Texas | 59.3 |
| 8 | Indiana | 59.1 |
| 9 | Iowa | 58.8 |
| 9 | Arkansas | 58.8 |
| 11 | Idaho | 58.6 |
| 12 | Tennessee | 58.5 |
| 13 | Oklahoma | 58.4 |
| 14 | Kansas | 58.3 |
| 15 | Louisiana | 58.2 |
| 16 | Mississippi | 57.4 |
| 17 | Alabama | 57.3 |
| 18 | Hawaii | 56.6 |
| 19 | Missouri | 55.9 |
| 20 | North Carolina | 55.8 |
| 21 | New Jersey | 55.7 |
| 22 | Ohio | 55.6 |
| 23 | South Carolina | 55.5 |
| 24 | Minnesota | 55.2 |
| 25 | Wyoming | 54.8 |
| 26 | Georgia | 54.7 |
| 27 | West Virginia | 54.3 |
| 28 | Virginia | 53.7 |
| 28 | Delaware | 53.7 |
| 30 | Montana | 53.3 |
| 30 | Maryland | 53.3 |
| 32 | Arizona | 53.2 |
| 33 | Wisconsin | 52.8 |
| 34 | Florida | 52.2 |
| 35 | New York | 52.1 |
| 36 | New Mexico | 51.9 |
| 37 | Colorado | 51.6 |
| 38 | Michigan | 51.5 |
| 39 | Washington | 51.3 |
| 40 | Pennsylvania | 51.2 |
| 41 | Nevada | 50.1 |
| 42 | California | 49.8 |
| 43 | Illinois | 49.7 |
| 44 | Connecticut | 48.9 |
| 45 | Massachusetts | 46.8 |
| 46 | Maine | 46.3 |
| 47 | Oregon | 46.1 |
| 48 | New Hampshire | 45.9 |
| 49 | Rhode Island | 45.0 |
| 50 | Vermont | 41.7 |
| 51 | District of Columbia | 39.8 |
Source: ValuePenguin analysis of Centers for Disease Control and Prevention (CDC) data. Note: The fertility rate is births per 1,000 women ages 15 to 44.
Fertility rose in 12 states even as the national rate fell
Although the nationwide picture is grim, fertility rates did rise in a dozen states. Colorado saw the biggest year-over-year increase between 2023 and 2024 at 2.8%, followed by West Virginia (2.3%) and Montana (2.1%).
While, again, the factors undergirding these trends are complex, the Colorado State Demography Office notes that births were the largest driver of population increase in the state in 2024. Young couples and families migrating into these states, many of which are in the Mountain West, can also be drivers of higher fertility rates.
In states where birth rates are on the rise, explains Deventer, "there might be more of a need to pay attention to family deductibles, out-of-pocket maximums, pediatric networks and hospital access." This is especially true for those planning to grow their own families.
The good news?
"For individual health insurance plans from marketplaces and for small-group insurance, maternity and newborn care are automatically included as essential health benefits," Deventer says. "That means most people won’t have a need for a separate maternity rider or policy. Instead, they might pay closer attention to family deductibles, coverage for fertility services and network quality when choosing coverage."
Full rankings: States with the biggest increases/decreases in fertility rates (2023 to 2024)
Rank | State | Fertility rate, 2023 | Fertility rate, 2024 | Change (%) |
|---|---|---|---|---|
| 1 | Colorado | 50.2 | 51.6 | 2.8% |
| 2 | West Virginia | 53.1 | 54.3 | 2.3% |
| 3 | Montana | 52.2 | 53.3 | 2.1% |
| 4 | Idaho | 57.6 | 58.6 | 1.7% |
| 4 | South Dakota | 65.6 | 66.7 | 1.7% |
| 6 | New Mexico | 51.5 | 51.9 | 0.8% |
| 7 | Nebraska | 62.5 | 62.9 | 0.6% |
| 7 | Wyoming | 54.5 | 54.8 | 0.6% |
| 9 | Utah | 59.6 | 59.9 | 0.5% |
| 10 | Oregon | 45.9 | 46.1 | 0.4% |
| 11 | Indiana | 58.9 | 59.1 | 0.3% |
| 12 | Missouri | 55.8 | 55.9 | 0.2% |
| 13 | Virginia | 53.7 | 53.7 | 0.0% |
| 14 | Washington | 51.4 | 51.3 | -0.2% |
| 14 | Kentucky | 60.4 | 60.3 | -0.2% |
| 16 | Iowa | 59.0 | 58.8 | -0.3% |
| 17 | Rhode Island | 45.2 | 45.0 | -0.4% |
| 17 | North Carolina | 56.0 | 55.8 | -0.4% |
| 17 | Georgia | 54.9 | 54.7 | -0.4% |
| 20 | Hawaii | 56.9 | 56.6 | -0.5% |
| 20 | South Carolina | 55.8 | 55.5 | -0.5% |
| 22 | Arkansas | 59.2 | 58.8 | -0.7% |
| 22 | Tennessee | 58.9 | 58.5 | -0.7% |
| 24 | Minnesota | 55.7 | 55.2 | -0.9% |
| 25 | Vermont | 42.1 | 41.7 | -1.0% |
| 25 | Alabama | 57.9 | 57.3 | -1.0% |
| 27 | New York | 52.7 | 52.1 | -1.1% |
| 28 | California | 50.4 | 49.8 | -1.2% |
| 28 | Oklahoma | 59.1 | 58.4 | -1.2% |
| 30 | Delaware | 54.4 | 53.7 | -1.3% |
| 30 | Michigan | 52.2 | 51.5 | -1.3% |
| 30 | Massachusetts | 47.4 | 46.8 | -1.3% |
| 30 | Pennsylvania | 51.9 | 51.2 | -1.3% |
| 34 | Nevada | 50.8 | 50.1 | -1.4% |
| 34 | Illinois | 50.4 | 49.7 | -1.4% |
| 34 | Ohio | 56.4 | 55.6 | -1.4% |
| 37 | Maryland | 54.1 | 53.3 | -1.5% |
| 37 | Wisconsin | 53.6 | 52.8 | -1.5% |
| 37 | Maine | 47.0 | 46.3 | -1.5% |
| 40 | Arizona | 54.2 | 53.2 | -1.8% |
| 41 | New Hampshire | 46.8 | 45.9 | -1.9% |
| 42 | Kansas | 59.5 | 58.3 | -2.0% |
| 43 | Texas | 60.6 | 59.3 | -2.1% |
| 44 | Alaska | 62.4 | 60.8 | -2.6% |
| 44 | Connecticut | 50.2 | 48.9 | -2.6% |
| 44 | North Dakota | 62.0 | 60.4 | -2.6% |
| 47 | New Jersey | 57.4 | 55.7 | -3.0% |
| 48 | Florida | 53.9 | 52.2 | -3.2% |
| 48 | Mississippi | 59.3 | 57.4 | -3.2% |
| 50 | Louisiana | 60.4 | 58.2 | -3.6% |
| 51 | District of Columbia | 43.0 | 39.8 | -7.4% |
Source: ValuePenguin analysis of CDC data. Note: The fertility rate is births per 1,000 women ages 15 to 44.
More Americans are being born than dying, but some states see more deaths
The birth-to-death ratio compares the births in a state or across the nation to the deaths that occur in the same year. Nationwide, the number of births continues to outpace the number of deaths, with a birth-to-death ratio of 1.18. (That means that for every 100 deaths, 118 babies were born.) The total number of U.S. births reached 3.63 million in 2024, compared with 3.07 million deaths.
By state, Utah was where the number of births most greatly exceeded deaths, with 2.17 births per death. Texas (1.70) and Alaska (1.62) follow.
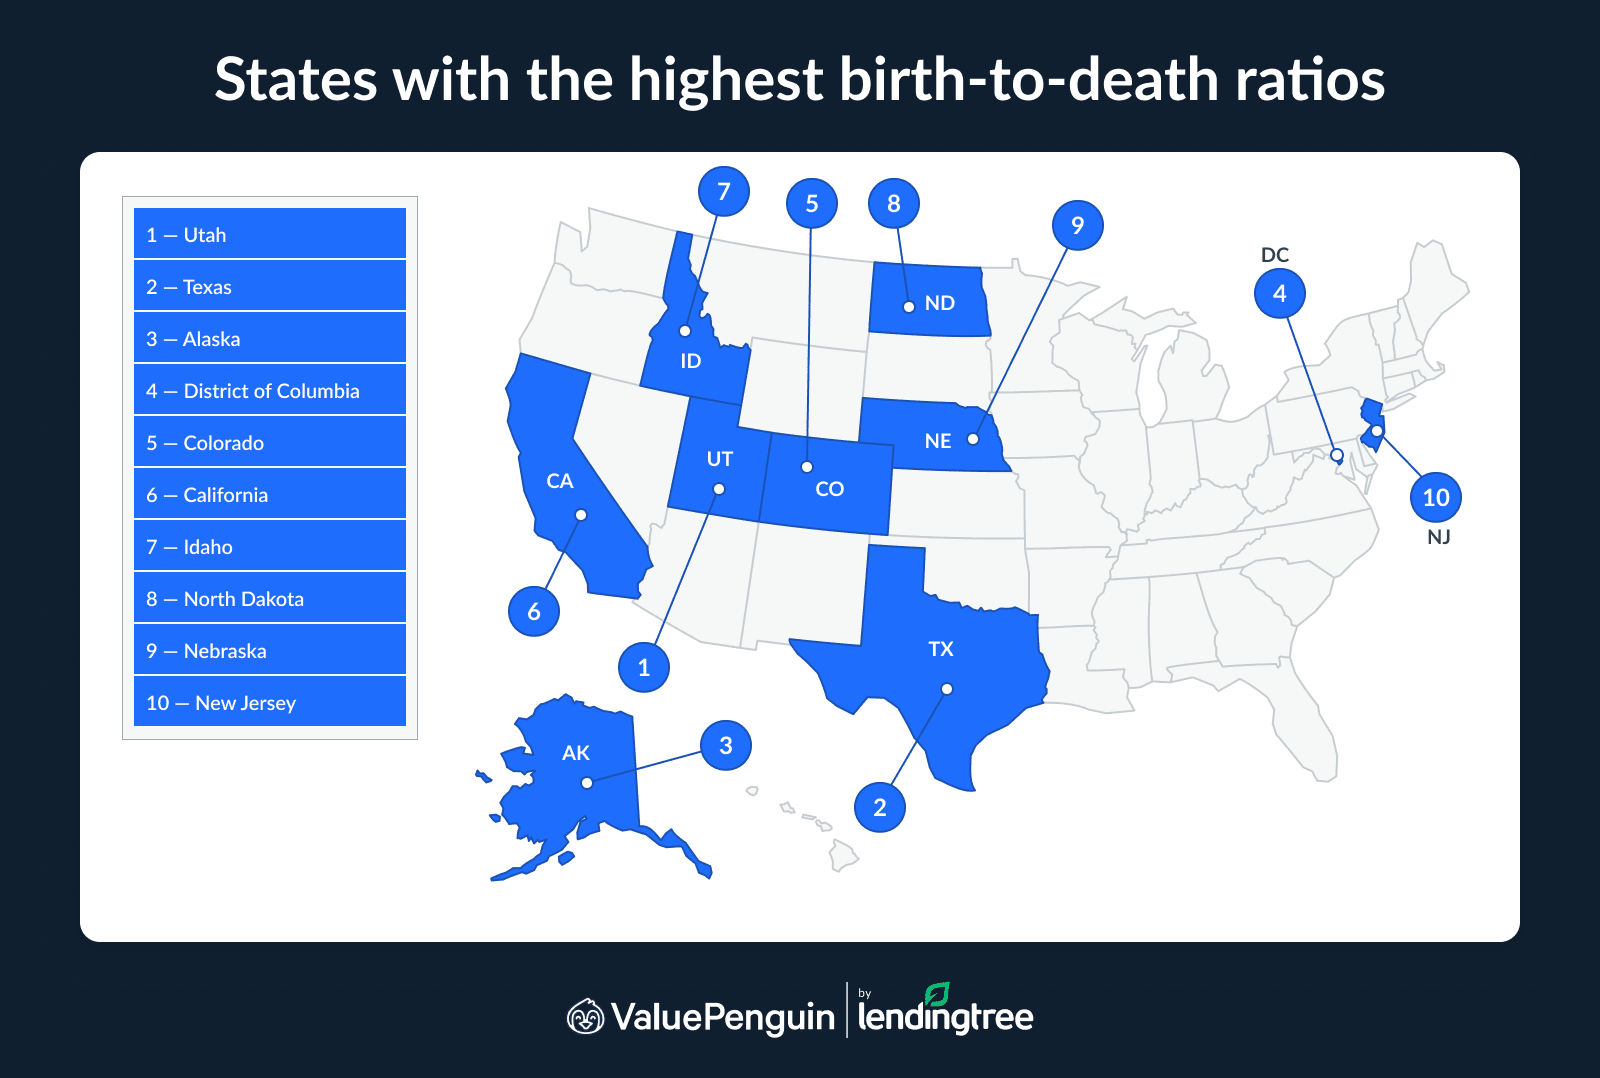
However, in 16 states, the death rate outpaced the birth rate — a precarious scenario that can lead to a shrinking population in the absence of inward migration. Maine and West Virginia face the toughest birth-to-death ratio, at just 0.70. This means there were only seven births for every 10 deaths in those states in 2024.
"A shrinking or aging population can cause issues and challenges for health insurance because it changes the balance of who is enrolled," Deventer explains. "When the population ages, insurance companies may have fewer younger enrollees to help offset the costs associated with older populations. This can push costs up for everyone."
Yet again, this tendency can lead to a catch-22 that makes it even more difficult for families to afford to have children, even if they want to.
Full rankings: States with the highest/lowest birth-to-death ratios (2024)
Rank | State | Births | Deaths | Births minus deaths | Births-to-deaths ratio |
|---|---|---|---|---|---|
| 1 | Utah | 46,664 | 21,499 | 25,165 | 2.17 |
| 2 | Texas | 390,828 | 229,560 | 161,268 | 1.70 |
| 3 | Alaska | 8,943 | 5,523 | 3,420 | 1.62 |
| 4 | District of Columbia | 7,616 | 4,817 | 2,799 | 1.58 |
| 5 | Colorado | 64,268 | 44,524 | 19,744 | 1.44 |
| 6 | California | 402,075 | 288,143 | 113,932 | 1.40 |
| 7 | Idaho | 23,276 | 16,758 | 6,518 | 1.39 |
| 8 | North Dakota | 9,634 | 6,966 | 2,668 | 1.38 |
| 9 | Nebraska | 24,785 | 18,271 | 6,514 | 1.36 |
| 10 | New Jersey | 101,372 | 74,876 | 26,496 | 1.35 |
| 11 | Georgia | 126,437 | 96,748 | 29,689 | 1.31 |
| 12 | South Dakota | 11,451 | 8,794 | 2,657 | 1.30 |
| 13 | New York | 205,489 | 159,614 | 45,875 | 1.29 |
| 14 | Washington | 83,118 | 65,664 | 17,454 | 1.27 |
| 15 | Minnesota | 62,110 | 49,771 | 12,339 | 1.25 |
| 16 | Maryland | 65,797 | 53,309 | 12,488 | 1.23 |
| 17 | Virginia | 94,054 | 77,311 | 16,743 | 1.22 |
| 18 | Hawaii | 14,917 | 12,793 | 2,124 | 1.17 |
| 19 | Kansas | 33,984 | 29,192 | 4,792 | 1.16 |
| 19 | North Carolina | 122,856 | 106,055 | 16,801 | 1.16 |
| 21 | Indiana | 80,257 | 69,509 | 10,748 | 1.15 |
| 22 | Massachusetts | 68,184 | 59,972 | 8,212 | 1.14 |
| 23 | Arizona | 78,711 | 70,469 | 8,242 | 1.12 |
| 23 | Illinois | 125,731 | 112,006 | 13,725 | 1.12 |
| 25 | Iowa | 36,436 | 32,817 | 3,619 | 1.11 |
| 26 | Nevada | 32,381 | 29,410 | 2,971 | 1.10 |
| 27 | Louisiana | 53,305 | 49,183 | 4,122 | 1.08 |
| 28 | Connecticut | 34,599 | 32,481 | 2,118 | 1.07 |
| 29 | Oklahoma | 47,962 | 45,056 | 2,906 | 1.06 |
| 29 | Tennessee | 83,833 | 79,360 | 4,473 | 1.06 |
| 29 | Wyoming | 6,089 | 5,728 | 361 | 1.06 |
| 32 | Wisconsin | 59,686 | 56,851 | 2,835 | 1.05 |
| 33 | Missouri | 67,998 | 66,642 | 1,356 | 1.02 |
| 34 | Kentucky | 52,913 | 52,387 | 526 | 1.01 |
| 34 | South Carolina | 58,768 | 58,235 | 533 | 1.01 |
| 36 | Ohio | 126,795 | 126,828 | -33 | 1.00 |
| 37 | Delaware | 10,550 | 10,681 | -131 | 0.99 |
| 38 | Alabama | 57,934 | 58,885 | -951 | 0.98 |
| 38 | Arkansas | 35,395 | 35,976 | -581 | 0.98 |
| 38 | Florida | 224,389 | 228,400 | -4,011 | 0.98 |
| 38 | Montana | 11,331 | 11,543 | -212 | 0.98 |
| 42 | Michigan | 99,525 | 102,819 | -3,294 | 0.97 |
| 42 | New Mexico | 21,328 | 22,013 | -685 | 0.97 |
| 42 | Rhode Island | 10,009 | 10,287 | -278 | 0.97 |
| 45 | Mississippi | 33,473 | 35,242 | -1,769 | 0.95 |
| 46 | Pennsylvania | 127,299 | 135,880 | -8,581 | 0.94 |
| 47 | Oregon | 38,963 | 42,248 | -3,285 | 0.92 |
| 48 | New Hampshire | 11,770 | 14,001 | -2,231 | 0.84 |
| 49 | Vermont | 5,023 | 6,706 | -1,683 | 0.75 |
| 50 | Maine | 11,601 | 16,595 | -4,994 | 0.70 |
| 50 | West Virginia | 17,022 | 24,268 | -7,246 | 0.70 |
Source: ValuePenguin analysis of CDC data. Notes: The birth-to-death ratio was calculated by dividing the number of live births by the number of deaths in each state. A ratio above 1.0 indicates births outnumbered deaths, while a ratio below 1.0 indicates deaths outnumbered births.
Tips for navigating health insurance during major family planning milestones
Health insurance is expensive no matter the size of your family, but for parents, the situation can become exponentially more challenging. Here are our top tips for navigating health insurance during major family planning milestones and keeping your coverage as affordable as possible.
- Review your current coverage — now. "Don't wait until you’re ready to start a family to look at the benefits on your plan," Deventer advises. "Review the deductibles, copays, coinsurance, out-of-pocket maximums and provider networks in advance. That way, if you need to switch policies, you have time."
- Get your paperwork in order. "Birth and adoption qualify families for a special enrollment period," Deventer says. "This lets you add your new child to your existing health insurance or shop for a new plan even outside of open enrollment. Make sure you know what paperwork your insurance company needs to add your child, and shop around to make sure you have the best plan for your family."
- Look beyond monthly rates. Although it’s tempting to choose the cheapest premium, "the lowest monthly rate isn't always the most affordable option," Deventer warns. "Families should evaluate the full potential cost of coverage, including deductibles and maximum out-of-pocket expenses. It’s also a good idea to look at customer service and provider networks to make sure the plan you choose is usable."
- Verify your providers’ participation. "Before you buy a plan, make sure your doctors and your new child’s doctors are in the network," Deventer advises. "If you get a plan that doesn’t include the doctors you want to see, you may have to pay out of pocket for any services you get at those offices."
- Remember: Your health isn’t static, and your plan shouldn’t be either. During every open enrollment period, says Deventer, it’s worth reviewing your coverage to make sure it still works for you. "As your child gets older, their needs will probably change, which means you might need to pick a plan with a different provider network or coverage for specific healthcare issues."
Methodology
ValuePenguin analyzed Centers for Disease Control and Prevention (CDC) data on U.S. fertility rates. The fertility rate is measured as the number of births per 1,000 women ages 15 to 44.
We compared fertility rates for 2023 and 2024 and calculated the percentage change for each state year-over-year.
Researchers also analyzed 2024 CDC birth and death data to calculate birth-to-death ratios. Birth-to-death ratios were calculated by dividing the number of births by the number of deaths in each state. A ratio above 1.0 indicates births exceeded deaths, while a ratio below 1.0 indicates deaths exceeded births.
About the Author
Personal Finance Writer
Jamie Cattanach is a personal finance writer and editor with more than a decade of experience. As an NFEC Certified Financial Education Instructor, she is especially passionate making financial literacy accessible to everyone and helping readers save for major life milestones.
Jamie has written content for major FinTech players such as SoFi, Chime and Capitalize, and her work has been featured in CNBC, USA TODAY and TIME.
Expertise
- Homeowners insurance
- Auto insurance
- Health insurance
Referenced by
- CNBC
- USA TODAY
- TIME
Credentials
- NFEC Certified Financial Education Instructor
Education
- BA, English; BA, Philosophy: Flagler College, 2013
Editorial note: The content of this article is based on the author's opinions and recommendations alone. It has not been previewed, commissioned or otherwise endorsed by any of our network partners.